Sign In
SSF Bioinformatics Hub
Start Page
Box Plot - Cross Experiment
Volcano Plot
Heat Map - Cross Experiment
Files
Start Page
Start Page
Box Plot - Cross Experiment
Volcano Plot
Heat Map - Cross Experiment
Files
JavaScript is disabled. For the full experience enable JavaScript in your browser.
3. Explore the skin diseases database
3. Explore the skin diseases database
Consensus Clustering
Print
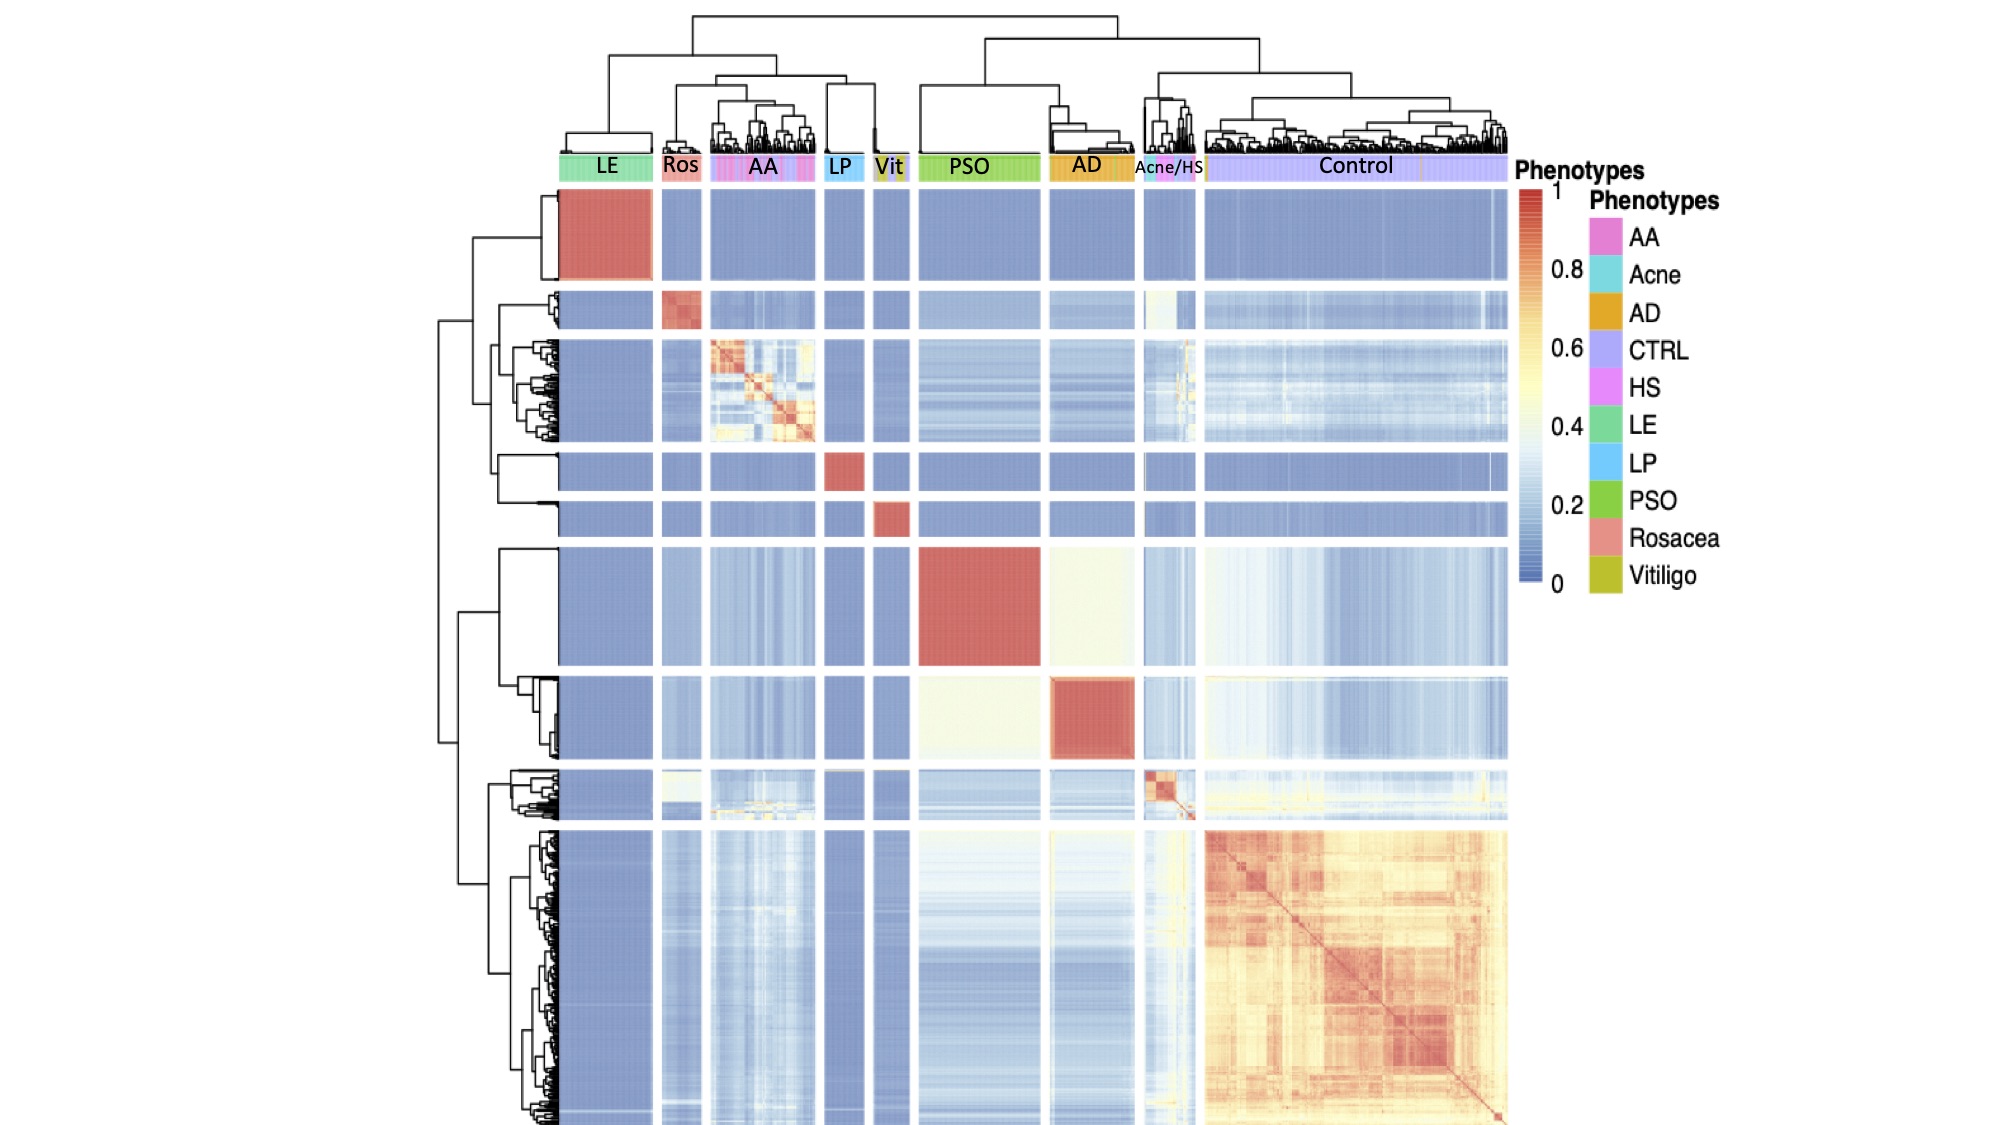
Figure 1:
Consensus clusters of integrated microarray data for 9 different skin diseases from 8 different experiments produced by SC3.
The heatmap represents the frequency of a cell clustering with a given cell across a permutation of cluster solutions where the diagonal
gives the frequency of a cell clustering with itself. The controls represent healthy and non-lesional biopsies across all experiments.