Sign In
SSF Bioinformatics Hub
Start Page
Box Plot - Cross Experiment
Volcano Plot
Heat Map - Cross Experiment
Files
Start Page
Start Page
Box Plot - Cross Experiment
Volcano Plot
Heat Map - Cross Experiment
Files
JavaScript is disabled. For the full experience enable JavaScript in your browser.
Start Page
Consensus Clustering
3. Explore the skin diseases database
Print
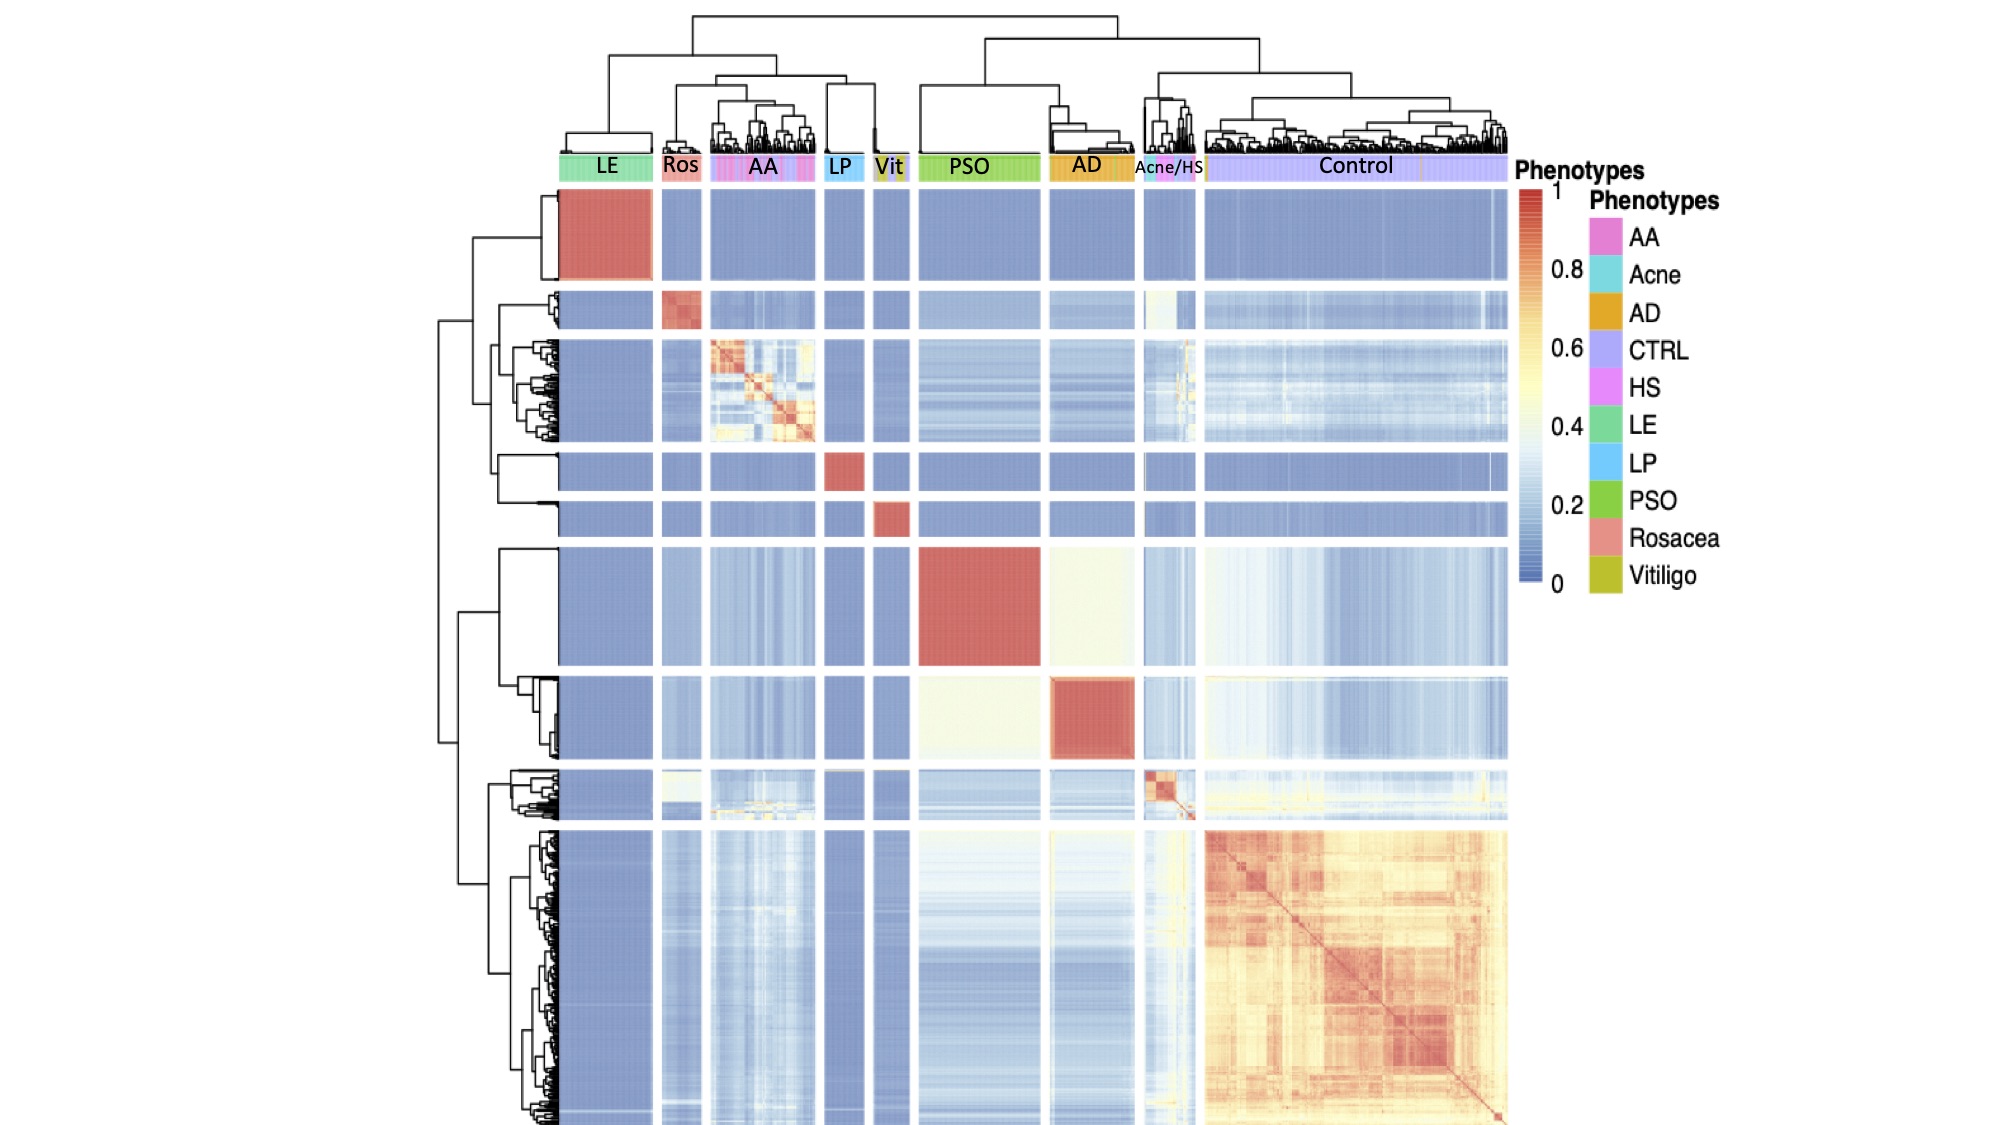
Figure 1:
Consensus clusters of integrated microarray data for 9 different skin diseases from 8 different experiments produced by SC3.
The heatmap represents the frequency of a cell clustering with a given cell across a permutation of cluster solutions where the diagonal
gives the frequency of a cell clustering with itself. The controls represent healthy and non-lesional biopsies across all experiments.
Discussions
Start email discussion
Discussion
Search
Scope
?
Site
Project
Current Folder
Current Folder & Subfolders
Categories
?
Assays
Datasets
Files
Issues
Lists
Messages
Subjects
Wikis
Sort
?
Relevance
Created
Modified
Folder Path
Reverse Sort Results
Pages
Print all
Analysis Overview
Files
Analysis Options
Analysis Workflow
Consensus Clustering
Disease Transcriptomic Profiles
Complete RatioA log2 Expression matrix
previous
next